
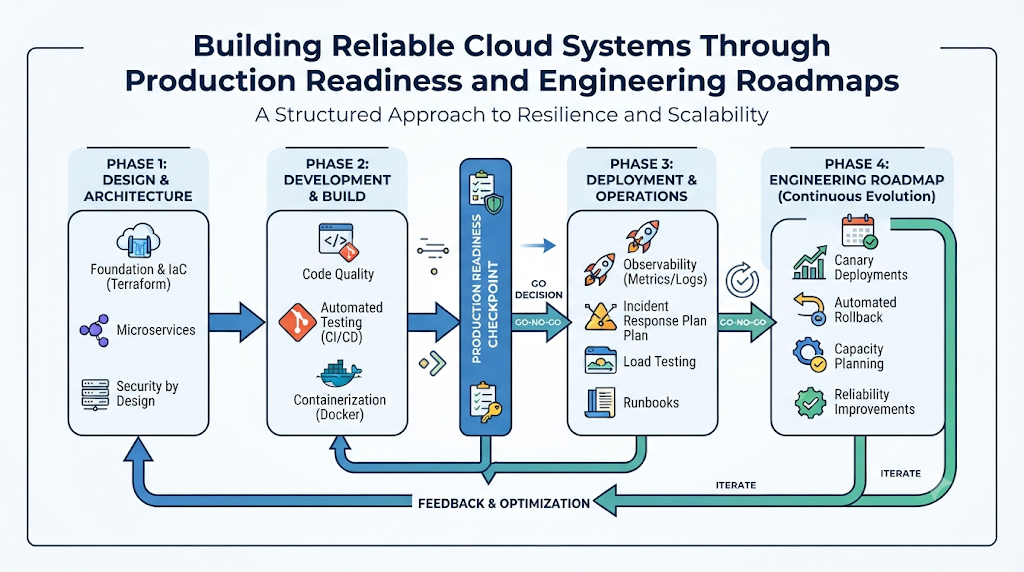
Introduction
Shipping software fast feels great until a small change breaks live traffic. Many teams build great features quickly but rush past safety checks. Then outages happen at night, and alerts wake everyone up. Modern cloud systems connect many moving parts. Containers, pipelines, databases, and cloud services all depend on each other. Without clear checks, small errors turn into big problems.
Teams need a calm and steady way to prepare releases. They also need clear paths to grow their daily engineering habits. A structured production readiness assessment helps teams spot weak spots before users feel them.
This guide shows how engineering teams build safer, steadier systems. It covers readiness checks, maturity reviews, Kubernetes care, platform work, reliability goals, incident response, security, monitoring, and cloud costs. It also shows how OpsRoadmaps helps teams organize clear growth paths without hype or guesswork.
Why Production Readiness Matters for Teams
Good code alone does not make a service ready for live users. A system also needs safe configs, clean backups, clear alerts, and fast recovery plans. When any piece is missing, releases carry extra risk.
A production readiness assessment checks whether a service can handle real traffic safely. Teams run it before launch and again as systems change. It is a habit, not a one-time pass or fail gate.
Even careful teams miss details when moving fast. A single check cannot promise zero bugs or zero downtime. Still, clear checks catch simple mistakes early and save hours of stress later.
Checking App Stability and Infrastructure
Start by checking how the app behaves under load. Test how it handles spikes, slow networks, and restarts. Make sure timeouts and retries do not overload backend services.
Next, check the servers, networks, and databases beneath the app. Confirm that nodes have enough room to scale up. Verify that failover works when a zone or instance drops.
Reviewing Backups, Access, and Docs
Backups only help if you can restore them fast. Test your backup restore steps on a regular schedule. Also plan disaster recovery for bigger regional or service failures.
Check who has access to production systems and data. Use least-privilege roles so people only get needed access. Keep runbooks and architecture notes clear so anyone on call can follow them.
Running a DevOps Maturity Assessment
Shipping code often takes more than a fast build tool. It takes trust between developers, testers, and operations staff. When teams work in silos, handoffs slow down and errors slip through.
A DevOps maturity assessment helps teams see how they work today. It looks at habits across the whole delivery cycle. Teams use it to spot bottlenecks and pick practical next steps.
Maturity models are guides, not strict rules for every company. A small team does not need heavy process for its own sake. The goal is steady flow, fast feedback, and fewer surprises.
Source Control, CI/CD, and Testing
Healthy teams keep all app code and config in source control. Small, frequent commits make reviews easier and rollbacks safer. Automated build and test pipelines catch bugs before code reaches users.
Automated tests should run fast and give clear results. Unit tests, integration checks, and smoke tests each play a role. Good feedback loops tell engineers quickly when something breaks.
Infrastructure as Code and Release Habits
Manual server changes often drift away from what is written down. Infrastructure as Code keeps setup repeatable and easy to review. Teams can track changes and rebuild environments with confidence.
Mature teams release in small batches more often. They use feature flags or safe rollouts to limit blast radius. When a release causes trouble, they can pause or roll back fast.
| Practice Area | Early Stage | Growing Stage | Mature Stage |
|---|---|---|---|
| Source Control & Code | Large manual merges and slow reviews | Small pull requests with basic checks | Trunk-based flow with fast peer reviews |
| CI/CD Automation | Manual builds and scripted deploys | Automated builds and staged deploys | Automated tests, gates, and safe rollbacks |
| Infrastructure Setup | Manual clicks in cloud consoles | Shared scripts and partial templates | Versioned templates for all environments |
| Monitoring & Feedback | Reactive checks after user reports | Basic alerts and shared dashboards | Actionable alerts tied to user health |
Kubernetes Production Readiness and Troubleshooting
Containers make apps portable, but clusters add many moving parts. Running workloads at scale takes careful planning. A Kubernetes production readiness checklist helps teams verify cluster and app health before go-live.
Start with cluster setup and high availability across zones. Spread worker nodes so one zone issue does not take down the app. Turn on role-based access control and keep cluster upgrades planned.
Requests, Limits, Probes, and Scaling
Always set CPU and memory requests and limits on pods. Requests help the scheduler place pods on healthy nodes. Limits stop one noisy container from starving its neighbors.
Add liveness and readiness probes to every workload. Readiness probes keep traffic away until a pod is truly ready. Liveness probes help restart stuck apps, but use them with care.
Configure horizontal pod autoscaling based on real load metrics. Pair scaling with pod disruption budgets during upgrades. That keeps enough replicas running while nodes drain.
Security, Storage, and Networking
Lock down container security settings early. Run containers as non-root users when possible and drop extra privileges. Store secrets safely instead of hardcoding them in manifests.
Use network policies to control traffic between pods. Do not let every pod talk to every other service by default. For stateful apps, test persistent volumes, storage classes, and snapshots.
Kubernetes CrashLoopBackOff Troubleshooting
Seeing a pod stuck in CrashLoopBackOff can feel stressful. It means Kubernetes starts the container, it exits, and Kubernetes waits longer between restarts. The status shows a restart loop, not the root cause itself.
Do not just delete or restart pods and hope it goes away. Restarting without looking hides clues and wastes time. Follow calm steps to read the real error first.
Start by listing pods and checking their state. Run kubectl get pods to see restart counts and age. Next, run kubectl describe pod to read recent scheduling and container events.
Check container logs next to see what the app printed. Use kubectl logs for the current container and kubectl logs --previous for the last crashed run. Also run kubectl get events to spot cluster-level warnings.
Common causes include bad startup commands or wrong arguments. Missing environment variables or broken config mounts also crash apps early. Memory limits set too low can trigger out-of-memory kills, and broken image tags or missing dependencies stop startup too.
Fix the root cause in code, config, or resource settings. Then apply the change and watch the pod stay healthy. Clear checks turn a scary loop into a quick fix.
| Check Area | What to Verify | Why It Matters |
|---|---|---|
| Resource Requests & Limits | CPU and memory set per container | Prevents bad scheduling and node pressure |
| Health Probes | Readiness and liveness endpoints configured | Keeps traffic off unhealthy or starting pods |
| Network & RBAC | Least-privilege roles and pod network rules | Limits lateral movement and unwanted traffic |
| Storage & Backups | Persistent volume claims and snapshot jobs | Protects stateful data during node shifts |
Platform Engineering Adoption Roadmap
Developers often spend too much time wiring up pipelines and cloud plumbing. Every team may copy old templates or invent new ones. This slows delivery and creates uneven setups across projects.
Platform engineering solves this by building internal tools for developers. An internal developer platform offers self-service paths for common tasks. It hides complex setup behind simple, safe choices.
A platform engineering adoption roadmap helps teams build this step by step. You do not need a giant platform on day one. Small teams and simple apps may need very little platform tooling.
Listening to Developers First
Talk to developers and see where they lose time each day. Look for repeated tasks like creating services, databases, or pipelines. Map current workflows before writing new platform code.
Define clear platform goals around speed, safety, and clarity. Treat internal users like real customers with honest feedback. Good developer experience comes from solving real friction, not adding layers.
Building Self-Service and Guardrails
Start with a small foundation that covers one or two common needs. Offer golden templates that wire up CI/CD, logging, and basic security. Make self-service easy so teams do not file tickets for routine work.
Keep strong guardrails built into the templates and service catalog. Monitor how platform tools perform and gather regular feedback. Improve features over time as team needs grow.
SRE Adoption Roadmap and Reliability Goals
Teams cannot make every system one hundred percent reliable at any cost. Pushing for perfection can slow releases and burn out engineers. Site Reliability Engineering balances new features with steady uptime.
An SRE adoption roadmap helps teams introduce reliability work gradually. Start with your most important user-facing services. Pick clear goals that match what users actually experience.
Reliability practices do not remove all incidents or guarantee zero downtime. Instead, they give teams clear signals and calm habits. Over time, teams spend less time on repetitive manual toil.
SLIs, SLOs, SLAs, and Error Budgets
A Service Level Indicator, or SLI, measures a key quality trait. Common examples include request success rate, latency, or availability. Pick metrics that reflect real user pain, not just server health.
A Service Level Objective, or SLO, sets a target for that SLI. For example, a team might aim for ninety-nine point nine percent good requests over thirty days. A Service Level Agreement, or SLA, is a broader promise or contract tied to those goals.
The error budget is the room left before missing the SLO. If your target allows some failure, you can spend that budget on releases and experiments. When the budget runs low, teams slow risky changes and fix reliability gaps.
Toil Reduction and Reliability Reviews
Toil is manual, repetitive, automatable work that brings no lasting value. Clicking the same buttons or running manual scripts every day drains energy. Automating high-toil tasks frees engineers for deeper design work.
Hold regular reliability reviews to check SLO health and error budgets. Plan capacity ahead of traffic growth or seasonal peaks. Use post-incident reviews to learn from misses without blaming people.
Incident Management Maturity Model
Outages will happen even in well-run cloud environments. How a team responds decides how long users feel the impact. A structured approach keeps response calm and focused.
An incident management maturity model shows how teams grow their response habits. Early stages often rely on ad-hoc chats and hero effort. Mature stages use clear roles, clean alerts, and steady follow-through.
Better maturity lowers confusion during high-stress moments, though it cannot stop every failure. Clear playbooks help anyone step up and guide the fix. Practice drills also help teams stay sharp before a real outage hits.
Detection, Triage, and Roles
Good incident response starts with clear, high-signal alerts. Noisy alerts cause alert fatigue and make real warnings easy to miss. Tune thresholds so pages fire when user health truly suffers.
Assign clear roles as soon as an incident starts. One person can lead coordination while others investigate the cause. Set clear severity levels and escalation paths so help arrives fast.
Communication, Recovery, and Learning
Share regular updates with teammates and affected users in plain language. Focus first on stopping the bleeding and restoring service. Rollbacks, traffic shifts, or failovers often restore service faster than deep debugging.
After recovery, run a blameless post-incident review while facts are fresh. Write down what happened, what helped, and what slowed the team down. Track corrective actions to completion and share lessons across teams.
DevSecOps Implementation Roadmap
Security works best when teams build it into daily work from the start. Waiting until the end of a release often causes delays and friction. Shared ownership helps developers and security engineers solve issues together.
A DevSecOps implementation roadmap brings security checks into normal workflows. Start small so teams are not flooded with hundreds of warnings at once. Keep checks fast so they support delivery instead of blocking it.
Security automation helps catch known flaws early, but it is not complete protection. Teams still need good design, careful reviews, and strong access habits. Ongoing learning keeps pace with new threats and tools.
Code, Dependencies, Containers, and Cloud
Encourage secure coding habits and check code early for common flaws. Scan third-party libraries and packages for known vulnerabilities. Check container images and base layers before pushing them to registries.
Scan infrastructure templates for risky settings like open ports or weak rules. Watch for leaked secrets in code and history before they spread. Enforce policy checks in CI/CD pipelines so bad configs get caught early.
Response, Compliance, and Shared Ownership
Define who owns fixing each type of security finding. Triage issues by real risk so teams fix high-impact items first. Track compliance checks continuously rather than scrambling before audits.
Share clear feedback with developers when a check fails. Explain how to fix the issue in simple terms. Over time, security becomes a normal part of building software.
Observability Maturity Model
Dashboards alone do not tell you why a complex system misbehaves. Modern apps span microservices, queues, caches, and cloud networks. Teams need deep visibility to trace problems across boundaries.
An observability maturity model helps teams grow from basic checks to rich insight. Early stages often watch simple host CPU and basic error logs. Higher stages connect signals across services to spot root causes faster.
Adding more charts or more alerts does not automatically improve observability. Cluttered screens can hide the real signal during an outage. Focus on clean data that answers real questions quickly.
Metrics, Logs, and Traces
Observability rests on three main types of telemetry data. Metrics are numeric counts or rates over time, like error rates or latency. They work great for trends, dashboards, and alerts.
Logs are time-stamped records of events from apps and systems. Centralized logging lets teams search and filter messages in one place. Structured logs make it much easier to spot patterns during errors.
Traces follow a single request as it moves across services. Distributed tracing shows where time is spent and where calls fail. Together with user experience checks, metrics, logs, and traces speed up debugging.
Cloud Cost Optimization Roadmap
Cloud billing can grow quietly as teams launch new services. Unused test instances, extra snapshots, and chatty network traffic add up fast. Good cost habits protect budgets without hurting reliability.
A cloud cost optimization roadmap gives teams a steady way to trim waste. Start by seeing where money goes today before making big cuts. Always balance cost savings with performance, uptime, and security needs.
Avoid guessing at savings percentages or chasing one-off tricks. Real cost control comes from clear tags, steady reviews, and smart sizing. Small fixes across many resources often add up nicely.
Visibility, Rightsizing, and Cleanup
Tag cloud resources clearly by team, app, and environment. Good tagging shows who owns each cost and prevents mystery bills. Set budget alerts so teams hear early when spending trends up.
Review compute and storage usage to spot oversized or idle resources. Right-size instances to match real workload needs and turn off unused items. Clean up old volumes, snapshots, and unattached network resources on a schedule.
Scaling, Commitments, and Ongoing Reviews
Use autoscaling and workload scheduling so non-production environments rest off-hours. Where workloads are steady, review reserved capacity options carefully. Check data transfer and storage tiers to avoid surprise egress or retention fees.
Hold regular cost reviews with engineering and finance leads. Track how changes affect both spend and system speed. Keep reliability guardrails in place so cost cuts never cause outages.
Turning Assessments Into Practical Roadmaps
Assessments only help when they lead to real action. A long list of findings can sit unused if nothing gets scheduled. Turn insights into a clear, realistic roadmap your team can follow.
Start by reviewing your current environment and listing top pain points. Pick a few clear goals that matter most to users and staff. Rank items by impact and effort so quick wins build momentum.
Do not try to roll out every new tool at once. Too many changes at once confuse teams and strain support. Assign clear owners, set honest timelines, and check progress often.
Roadmaps should stay flexible as your product and team evolve. Revisit priorities every few weeks or quarters as lessons emerge. OpsRoadmaps opsroadmaps.com helps engineers explore structured roadmaps across DevOps, cloud, Kubernetes, platform engineering, SRE, security, observability, and cost topics. Using clear roadmaps makes it easier to connect daily tasks with long-term engineering goals.
Frequently Asked Questions
What is a production readiness assessment?
A production readiness assessment is a structured check of whether a service is safe for live users. It reviews code stability, infrastructure, security, backups, alerts, and recovery steps. Teams use it to catch gaps before launch and keep systems steady over time.
How does a DevOps maturity assessment help engineering teams?
A DevOps maturity assessment shows how well a team automates builds, tests, releases, and infrastructure. It highlights gaps in collaboration, feedback loops, and delivery speed. Teams use those insights to plan practical, step-by-step improvements.
What belongs on a Kubernetes production readiness checklist?
A Kubernetes production readiness checklist covers cluster availability, resource requests and limits, health probes, and scaling rules. It also checks network policies, secrets handling, storage backups, logging, and access controls. Reviewing these areas helps prevent outages and surprises in production.
How should we start a Kubernetes CrashLoopBackOff troubleshooting check?
Start with Kubernetes CrashLoopBackOff troubleshooting by checking pod status and recent events. Run commands to inspect pod details and read both current and previous container logs. Look for bad commands, missing variables, memory limits, or app errors before changing settings.
When is a platform engineering adoption roadmap a good fit?
A platform engineering adoption roadmap fits when multiple teams repeat the same setup and pipeline work. It helps build self-service templates and clear guardrails to speed up delivery. Small teams with simple needs should keep tooling light until complexity grows.
How do you begin an SRE adoption roadmap without slowing teams?
Begin an SRE adoption roadmap on one or two critical services first. Define simple SLIs, realistic SLOs, and an error budget to guide release pace. Automating repetitive toil also gives engineers more time to improve reliability.
What does an incident management maturity model improve? An incident management maturity model helps teams move from chaotic firefighting to calm, clear response. It improves alert quality, role clarity, communication, fast recovery, and blameless follow-ups. Over time, teams resolve issues faster and learn from every event.
How does a DevSecOps implementation roadmap work in practice?
A DevSecOps implementation roadmap adds code, dependency, container, and cloud checks into daily workflows. Teams start with top risks and integrate fast checks into CI/CD pipelines. Shared ownership helps fix issues early without creating heavy bottlenecks.
How do metrics, logs, and traces fit an observability maturity model?
In an observability maturity model, metrics show trends and health over time. Logs capture detailed event records, while traces follow requests across services. Together they help teams find root causes faster than basic checks alone.
What is the safest way to follow a cloud cost optimization roadmap?
Follow a cloud cost optimization roadmap by tracking spend with tags, budgets, and regular reviews. Right-size workloads, remove idle resources, and schedule non-production environments cleanly. Always check performance and reliability impacts before cutting capacity.
Conclusion
Reliable cloud systems come from steady habits, clear checks, and thoughtful planning. Production readiness reviews, maturity checks, Kubernetes care, platform work, SRE goals, incident habits, security checks, observability, and cost control all support one another. Small, steady steps beat big, risky overhauls every time.
Structured roadmaps help teams turn big ideas into calm daily progress. With OpsRoadmaps, engineers and leaders can explore clear roadmaps for modern cloud and delivery practices. Keep learning, keep testing your assumptions, and build systems your team can run with confidence.